[36]:
# Remove input cells at runtime (nbsphinx)
import IPython.core.display as d
d.display_html('<script>jQuery(function() {if (jQuery("body.notebook_app").length == 0) { jQuery(".input_area").toggle(); jQuery(".prompt").toggle();}});</script>', raw=True)
Parametrized images vs true information (TRAINING)
This notebook uses data generated via protopipe.scripts.data_training with the option --save_images (from the GRID interface due to the amount of data), so we use store information of the simulated images together with the reconstructed ones.
It can be run from any training run data file, but it is meant to be executed using data from the gamma-1 sample, aka the one used to train the energy model.
Warning:
The merged data training file from the gamma-1 sample with true images can be as heavy as ~80Gb!
Here only 10 following runs have been merged into 1 table, which is then a sub-sample of gamma1:
TRAINING_energy_gamma_tail_run101.h5
TRAINING_energy_gamma_tail_run102.h5
TRAINING_energy_gamma_tail_run103.h5
TRAINING_energy_gamma_tail_run104.h5
TRAINING_energy_gamma_tail_run105.h5
TRAINING_energy_gamma_tail_run106.h5
TRAINING_energy_gamma_tail_run107.h5
TRAINING_energy_gamma_tail_run108.h5
TRAINING_energy_gamma_tail_run109.h5
TRAINING_energy_gamma_tail_run10.h5
TODO(s):
Comparison between reconstructed and true parameters
Table of contents
Total image charge (“Intensity”) resolution for selected images
Comparison between simulated and reconstructed image parameters
[54]:
from pathlib import Path
import numpy as np
from scipy.stats import binned_statistic
import tables
import pandas
import matplotlib.pyplot as plt
from matplotlib.colors import LogNorm

from ctapipe.instrument import CameraGeometry
from ctapipe.image.hillas import hillas_parameters
[38]:
def get_camera_names(inputPath = None):
    """Read the names of the cameras.

    Parameters
    ==========
    inputPath : str
        Full path of the input DL1 file.

    Returns
    =======
    camera_names : list(str)
        Table names as a list.
    """
    if inputPath is None:
        print("ERROR: check input path")
        return None
    h5file = tables.open_file(inputPath, mode='r')
    group = h5file.get_node("/")
    camera_names = [x.name for x in group._f_list_nodes()]
    h5file.close()
    return camera_names
[39]:
def load_reset_infile_protopipe(inputPath = None, camera_names=None):
    """(Re)load the file containing DL1(a) data and extract the data per telescope type.

    Parameters
    ==========
    inputPath : str
        Full path of the input DL1 file.
    camera_names : list
        List f camera IDs.

    Returns
    =======
    dataFrames : dict(pandas.DataFrame)
        Dictionary of tables per camera.
    """
    if inputPath is None:
        print("ERROR: check input path")
        return None
    if camera_names is None:
        print("ERROR: no cameras specified")
        return None
    # load DL1 images
    dataFrames = {camera : pandas.read_hdf(inputPath, f"/{camera}") for camera in camera_names}
    return dataFrames
[40]:
indir = Path("/Volumes/DataCEA_PERESANO/Data/CTA/shared_folder/analyses/v0.4.0_dev1_only_gamma1_with_images/data/TRAINING/for_energy_estimation")
fileName = "TRAINING_energy_gamma_tail_10runs.h5"
infile = indir / fileName
[41]:
cameras = get_camera_names(inputPath = infile)
[42]:
h5file = tables.open_file(infile, mode='r')
data = {camera : h5file.get_node(f"/{camera}") for camera in cameras}
[43]:
# select only images with cut in
# - Intensity>50 (in the "biased" units)
# - 80% camera radius containment (defined as 2.31 deg for LST, 4.05 deg for NectarCam)
# - maximum impact parameter of 200 m
selected_images = {}
for camera in cameras:
    cam_radius_deg = {"LSTCam" : 2.31, "NectarCam" : 4.05}
    selected_images[camera] = data[camera][(data[camera].col("hillas_intensity_reco")>50.) &
                                           (data[camera].col("hillas_r")<0.8*cam_radius_deg[camera]) &
                                           (data[camera].col("impact_dist")<200.)]
[44]:
tot_true_phe = {}
hillas_intensity_reco = {}

for camera in cameras:
    tot_true_phe[camera] = np.sum(selected_images[camera]["true_image"], axis=1)
    hillas_intensity_reco[camera] = selected_images[camera]["hillas_intensity_reco"]
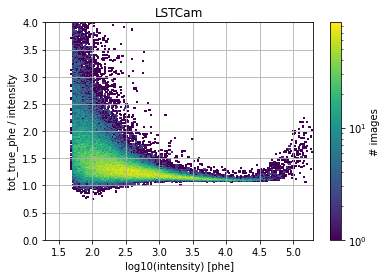
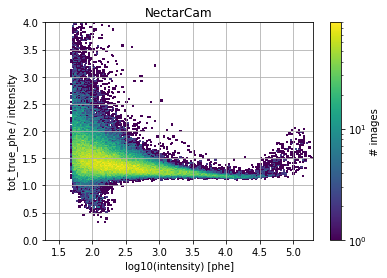
Total image charge (“Intensity”) resolution for selected images
The data used needs to be TRAINING data from the gamma-1 sample selected with the following cuts: - intensity > 50 phe (in the “biased” units from the calibration notebook) - 80% camera radius containment (defined as 2.31 deg for LST, 4.05 deg for NectarCam) - maximum impact parameter of 200 m
Distributions
[45]:
nbins_x_edges = np.linspace(1.298, 5.298, 200)
nbins_y__edges = np.linspace(0., 4., 200)

for camera in cameras:

    plt.figure()

    plt.hist2d(x = np.log10(hillas_intensity_reco[camera]),
               y = tot_true_phe[camera] / hillas_intensity_reco[camera],
               bins=[nbins_x_edges,nbins_y__edges],
               #range=[x_range,y_range],
               norm=LogNorm()
              )

    cbar = plt.colorbar()
    cbar.set_label("# images")

    plt.title(camera)
    plt.xlabel("log10(intensity) [phe]")
    plt.ylabel("tot_true_phe / intensity")

    plt.grid(which="both", axis="both")

    #plt.savefig(f"./correlation_intensity_trueCharge_ditribution_{camera}_protopipe_dev.png")

None
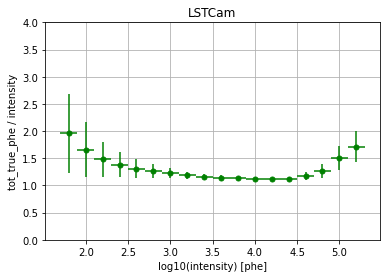
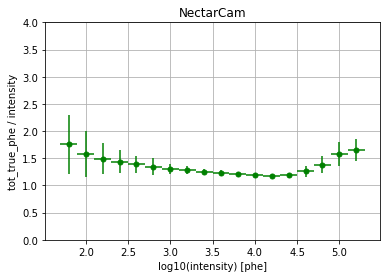
Mean and RMS as error bar of intensity profile
[46]:
profiled_mean = {}
profiled_std = {}

# x-axis edges from CTAMARS reference file named "check_dl1b.root"
bins = np.array([1.298, 1.498, 1.698, 1.898, 2.098, 2.298, 2.498, 2.698, 2.898,
       3.098, 3.298, 3.498, 3.698, 3.898, 4.098, 4.298, 4.498, 4.698,
       4.898, 5.098, 5.298])

for camera in cameras:
    profiled_mean[camera], x_edges, xbinnumber = binned_statistic(x = np.log10(hillas_intensity_reco[camera]),
                                                 values = tot_true_phe[camera] / hillas_intensity_reco[camera],
                                                 statistic='mean',
                                                 bins=bins)
    profiled_std[camera], x_edges, xbinnumber = binned_statistic(x = np.log10(hillas_intensity_reco[camera]),
                                                 values = tot_true_phe[camera] / hillas_intensity_reco[camera],
                                                 statistic='std',
                                                 bins=bins)
[47]:
for camera in cameras:

    plt.figure()

    plt.errorbar(x = 0.5 * (x_edges[1:] + x_edges[:-1]),
                 y = profiled_mean[camera],
                 yerr=profiled_std[camera],
                 xerr=np.diff(x_edges)/2.,
                 fmt='go',
                 ecolor="g",
                 markersize=5)


    plt.title(camera)
    plt.ylim(0.,4.)
    plt.xlabel("log10(intensity) [phe]")
    plt.ylabel("tot_true_phe / intensity")

    plt.grid(which="both", axis="both")

    #plt.savefig(f"./correlation_intensity_trueCharge_mean+RMSerrorbar_{camera}_protopipe_dev.png")
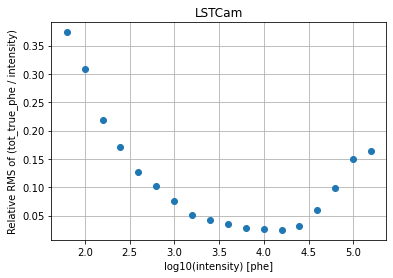
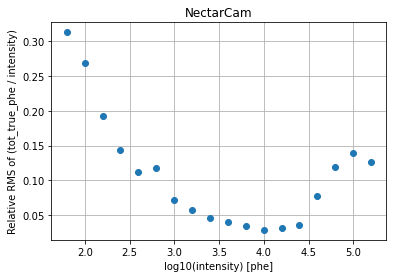
RMS/Mean
[48]:
for camera in cameras:

    plt.figure()

    plt.plot(0.5 * (x_edges[1:] + x_edges[:-1]), profiled_std[camera]/profiled_mean[camera], 'o')


    plt.title(camera)
    plt.xlabel("log10(intensity) [phe]")
    plt.ylabel("Relative RMS of (tot_true_phe / intensity)")

    plt.grid(which="both", axis="both")

    #plt.savefig(f"./correlation_intensity_trueCharge_meanRMSratio_{camera}_protopipe_dev.png")
Comparison between simulated and reconstructed image parameters
For this section we try to select images just as in the pipeline without the impact parameter cut used in the previous section in order to allow for differentiation between low/high energy showers near/far from the array center.
Cuts applied:
intensity > 50 phe (in the “biased” units from the calibration notebook)
80% camera radius containment (defined as 2.31 deg for LST, 4.05 deg for NectarCam)
ellipticity comprised between 0.1 and 0.6
Slices in true energy are also applied.
We use for simplicity only 1 run (#101) from the gamma-1 sample.
[49]:
indir = Path("/Volumes/DataCEA_PERESANO/Data/CTA/shared_folder/analyses/v0.4.0_dev1_only_gamma1_with_images/data/TRAINING/for_energy_estimation")
fileName = "TRAINING_energy_gamma_tail_run101.h5"
infile = indir / fileName
[50]:
cameras = get_camera_names(inputPath = infile)
[51]:
h5file = tables.open_file(infile, mode='r')
data = {camera : h5file.get_node(f"/{camera}") for camera in cameras}
[52]:
selected_images = {}

for camera in cameras:
    cam_radius_deg = {"LSTCam" : 2.31, "NectarCam" : 4.05}
    selected_images[camera] = data[camera][(data[camera].col("hillas_intensity_reco")>50.) &
                                           (data[camera].col("hillas_r")<0.8*cam_radius_deg[camera]) &
                                           (data[camera].col("hillas_ellipticity")> 0.1) &
                                           (data[camera].col("hillas_ellipticity")<0.6)
                                          ]
[55]:
true_parameters = {}

for camera in cameras:

    geom = CameraGeometry.from_name(camera)
    true_parameters[camera] = []

    for image in selected_images[camera]["true_image"]:
          true_parameters[camera].append(hillas_parameters(geom, image))

    true_parameters[camera] = np.asarray(true_parameters[camera])
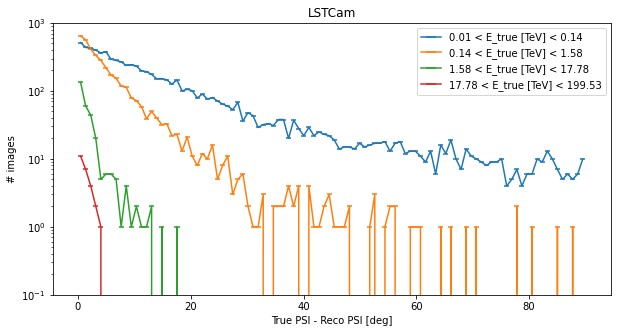
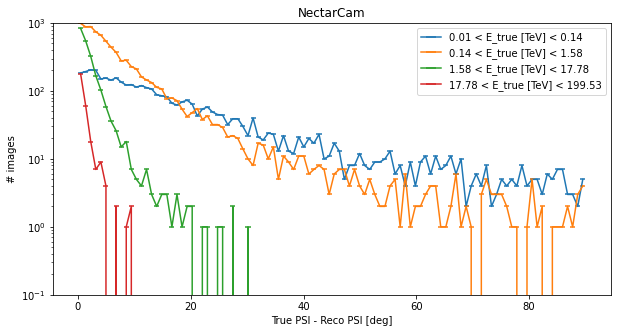
PSI
[60]:
true_psi = {}

true_energy_bins = np.logspace(-1.9,2.3,5)

for i, camera in enumerate(cameras):

    plt.figure(figsize=(10,5))

    true_psi = [true_parameters[camera][image].psi.to("deg").value for image in range(len(true_parameters[camera]))]
    true_psi = np.asarray(true_psi)

    for j in range(len(true_energy_bins)-1):

        true_energy = selected_images[camera]["true_energy"]

        energy_mask = (true_energy > true_energy_bins[j]) & (true_energy < true_energy_bins[j+1])

        delta_psi = np.abs(true_psi - selected_images[camera]["hillas_psi"])[energy_mask]

        counts_delta_psi, x_bins = np.histogram(delta_psi, bins=100, range=[0.,90.])

        plt.errorbar(x = 0.5 * (x_bins[:-1] + x_bins[1:]),
                     y = counts_delta_psi,
                     xerr = np.diff(x_bins)/2.,
                     yerr = None,
                     label=f"{true_energy_bins[j]:.2f} < E_true [TeV] < {true_energy_bins[j+1]:.2f}"
                    )

    plt.title(camera)
    plt.legend(loc="best")
    plt.xlabel("True PSI - Reco PSI [deg]")
    plt.ylabel("# images")
    plt.yscale("log")
    plt.ylim(1.e-1,1.e3)

None
[ ]: