[3]:
# Remove input cells at runtime (nbsphinx)
import IPython.core.display as d
d.display_html('<script>jQuery(function() {if (jQuery("body.notebook_app").length == 0) { jQuery(".input_area").toggle(); jQuery(".prompt").toggle();}});</script>', raw=True)
Direction reconstruction (TRAINING)
Author(s): - Dr. Michele Peresano (CEA-Saclay/IRFU/DAp/LEPCHE), 2020
Description:
NOTES:
these benchmarks will be cross-validated and migrated in cta-benchmarks/ctaplot
Let’s try to follow this document by adding those benchmarks or proposing new ones.
Requirements:
The data format required to run the notebook is the current one used by protopipe . Soon it will be the same as in ctapipe (1 full DL1 file + 1 DL2 file with only shower geometry information).
Development and testing:
TODO:
…
Table of contents
Reconstruction efficiency relative to the number of stereoscopic triggers
Distribution of true core positions for reconstructed events
[4]:
import os
from pathlib import Path

import tables
import pandas
import numpy as np
import uproot
import matplotlib.pyplot as plt
from matplotlib.colors import LogNorm
[5]:
def get_camera_names(inputPath = None, fileName = None):
    """Read the names of the cameras.

    Parameters
    ==========
    infile : str
        Full path of the input DL1 file.
    fileName : str
        Name of the input DL1 file.

    Returns
    =======
    camera_names : list(str)
        Table names as a list.
    """
    if (inputPath is None) or (fileName is None):
        print("ERROR: check input")
    h5file = tables.open_file(os.path.join(inputPath, fileName), mode='r')
    group = h5file.get_node("/")
    camera_names = [x.name for x in group._f_list_nodes()]
    h5file.close()
    return camera_names
[6]:
def load_reset_infile_protopipe(inputPath = None, fileName = None, camera_names=None):
    """(Re)load the file containing DL1(a) data and extract the data per telescope type.

    Parameters
    ==========
    infile : str
        Full path of the input DL1 file.
    fileName : str
        Name of the input DL1 file.

    Returns
    =======
    dataFrames : dict(pandas.DataFrame)
        Dictionary of tables per camera.
    """
    if (inputPath is None) or (fileName is None):
        print("ERROR: check input")
    if camera_names is None:
        print("ERROR: no cameras specified")
    # load DL1 images
    dataFrames = {camera : pandas.read_hdf(os.path.join(inputPath, fileName), f"/{camera}") for camera in camera_names}
    return dataFrames
[7]:
def add_stats(x, ax):
    """Add a textbox containing statistical information."""
    mu = x.mean()
    median = np.median(x)
    sigma = x.std()
    textstr = '\n'.join((
        r'$\mu=%.2f$' % (mu, ),
        r'$\mathrm{median}=%.2f$' % (median, ),
        r'$\sigma=%.2f$' % (sigma, )))

    # these are matplotlib.patch.Patch properties
    props = dict(boxstyle='round', facecolor='wheat', alpha=0.5)

    # place a text box in upper left in axes coords
    ax.text(0.70, 0.85,
            textstr,
            transform=ax.transAxes,
            fontsize=10,
            horizontalalignment='left',
            verticalalignment='center',
            bbox=props)
[8]:
# Modify these variables according to your local setup outside of the Vagrant Box
parentDir = "/Users/michele/Applications/ctasoft/dirac" # path to 'shared_folder'
analysisName = "v0.4.0_dev1"
[9]:
indir = os.path.join(parentDir,
                      "shared_folder/analyses",
                      analysisName,
                      "data/TRAINING/for_energy_estimation")
infile = "TRAINING_energy_tail_gamma_merged.h5"

cameras = get_camera_names(inputPath = indir,
                                   fileName = infile)
data = load_reset_infile_protopipe(inputPath = indir,
                                   fileName = infile,
                                   camera_names=cameras)
[10]:
# select only successfully reconstructed showers
reconstructed_showers = {}
for camera in cameras:
    reconstructed_showers[camera] = data[camera][(data[camera]["is_valid"]==True)]
[11]:
indir_refData = "/Volumes/DataCEA_PERESANO/Data/CTA/ASWG/Prod3b/Release_2019/CTAMARS_reference_data/TRAINING/DL2" # path to CTAMARS ROOT file
mars_dl2a_fileName = "CTA_check_dl2_4L15M.root"
path_mars_dl2a = os.path.join(indir_refData, mars_dl2a_fileName)
[12]:
with uproot.open(path_mars_dl2a) as CTAMARS:
    CTAMARS_angres = CTAMARS["angres"]
    CTAMARS_reco_fraction = CTAMARS["reco_fraction"]
    CTAMARS_histcore = CTAMARS["histcore"]
    CTAMARS_coreres = CTAMARS["coreres"]
[13]:
# TODO
[14]:
# First we check if a _plots_ folder exists already.
# If not, we create it.
Path("./plots").mkdir(parents=True, exist_ok=True)
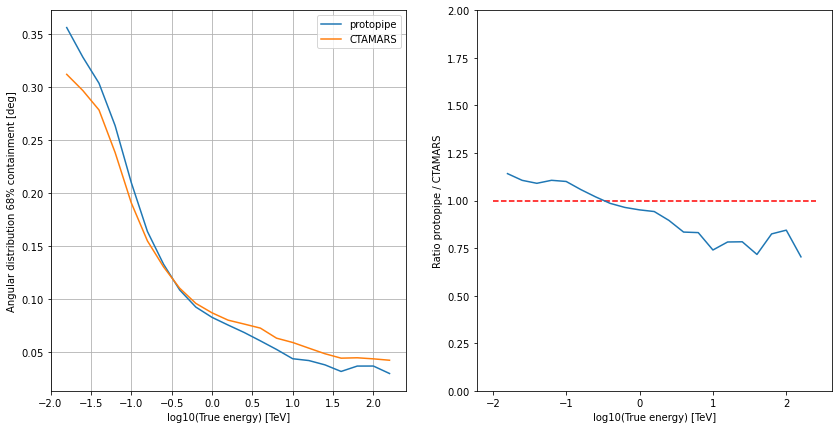
Angular resolution
[15]:
true_energy_bin_edges = CTAMARS_reco_fraction.member("fXaxis").edges()
true_energy_bin_centers = 0.5 * (true_energy_bin_edges[:-1] + true_energy_bin_edges[1:])
[16]:
reco_showers_stereo_LST = {}
for i, camera in enumerate(cameras):
    # for each camera select only images corresponing to events seen by either None or at least 2 LSTs (LST stereo trigger condition)
    reco_showers_stereo_LST[camera] = reconstructed_showers[camera][(reconstructed_showers[camera]["N_LST"] == 0) | (reconstructed_showers[camera]["N_LST"] >= 2)]
    # then merge the tables
    if i==0:
        all_reco_showers_stereo_LST = reco_showers_stereo_LST[camera]
    else:
        all_reco_showers_stereo_LST = all_reco_showers_stereo_LST.append(reco_showers_stereo_LST[camera])
# Finally drop duplicate showers (stereo information is the same for each event ID)
unique_all_reco_showers_stereo_LST = all_reco_showers_stereo_LST.drop_duplicates(subset=['event_id'])
[17]:
fig = plt.figure(figsize=(14, 7), tight_layout=False)

plt.subplot(1,2,1)

plt.xlabel("log10(True energy) [TeV]")
plt.ylabel("Angular distribution 68% containment [deg]")

# protopipe

theta = {}
ang_res = np.zeros(len(true_energy_bin_centers))

true_energy = np.log10(unique_all_reco_showers_stereo_LST["true_energy"])
offset = unique_all_reco_showers_stereo_LST["offset"]

for i in range(len(true_energy_bin_centers)):

    mask = (true_energy > true_energy_bin_edges[i]) & (true_energy <= true_energy_bin_edges[i + 1])
    selected_offsets = np.sort(offset[mask])
    ang_res[i] = np.percentile(selected_offsets, 68.0)

plt.plot(true_energy_bin_centers, ang_res, '-', label = "protopipe")

# CTAMARS
plt.plot(CTAMARS_angres.member("fX"), CTAMARS_angres.member("fY"), '-', label = "CTAMARS")

plt.grid(which="both")
plt.legend()

plt.subplot(1,2,2)

plt.xlabel("log10(True energy) [TeV]")
plt.ylabel("Ratio protopipe / CTAMARS")

plt.plot(CTAMARS_angres.member("fX"), ang_res/CTAMARS_angres.member("fY"), '-', label = "CTAMARS")
plt.hlines(1.0, plt.gca().get_xlim()[0], plt.gca().get_xlim()[1], linestyle= '--', color="red")
plt.ylim(0, 2)

plt.show()

fig.savefig(f"./plots/training_angular_resolution_protopipe_{analysisName}.png")
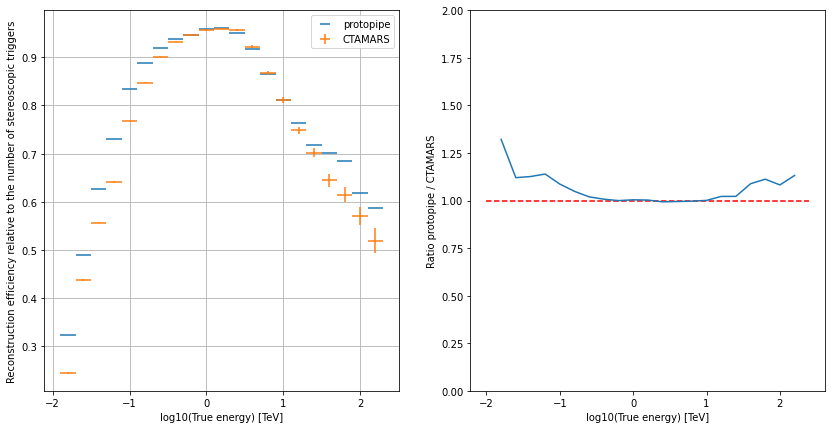
Reconstruction efficiency relative to the number of stereoscopic triggers
Selection cuts: - all showers with >=2 valid images, - LST-subarray stereo trigger, i.e. either 0 or >=2 triggered LSTs (LST-subarray hardware trigger was not required in the simulation)
[18]:
all_cameras = data["LSTCam"].append(data["NectarCam"])
all_unique_showers = all_cameras.drop_duplicates(subset=['event_id'])
all_unique_showers_stereo_LST = all_unique_showers[(all_unique_showers["N_LST"] == 0) | (all_unique_showers["N_LST"] >= 2)]
reco_showers_stereo_LST = all_unique_showers_stereo_LST[all_unique_showers_stereo_LST["is_valid"]==True]
[19]:
H_all = np.histogram(np.log10(all_unique_showers_stereo_LST["true_energy"]), bins=true_energy_bin_edges)
H_reco = np.histogram(np.log10(reco_showers_stereo_LST["true_energy"]), bins=true_energy_bin_edges)
reconstruction_efficiency = H_reco[0] / H_all[0]
[20]:
fig = plt.figure(figsize=(14, 7), tight_layout=False)

plt.subplot(1,2,1)

plt.xlabel("log10(True energy) [TeV]")
plt.ylabel("Reconstruction efficiency relative to the number of stereoscopic triggers")

plt.errorbar(true_energy_bin_centers,
             reconstruction_efficiency,
             xerr=np.diff(true_energy_bin_edges)/2,
             yerr = None,
             ls='none',
             label = "protopipe")

plt.errorbar(x = true_energy_bin_centers,
             y = CTAMARS_reco_fraction.to_numpy()[0],
             xerr = np.diff(true_energy_bin_edges)/2,
             yerr = CTAMARS_reco_fraction.errors(),
             ls='none',
             label = "CTAMARS")

plt.grid(which="both")
plt.legend(loc="best")

plt.subplot(1,2,2)

plt.xlabel("log10(True energy) [TeV]")
plt.ylabel("Ratio protopipe / CTAMARS")

plt.plot(true_energy_bin_centers,
         reconstruction_efficiency/CTAMARS_reco_fraction.to_numpy()[0],
         '-')
plt.hlines(1.0, plt.gca().get_xlim()[0], plt.gca().get_xlim()[1], linestyle= '--', color="red")
plt.ylim(0, 2)

fig.savefig(f"./plots/training_reconstruction_efficiency_protopipe_{analysisName}.png")
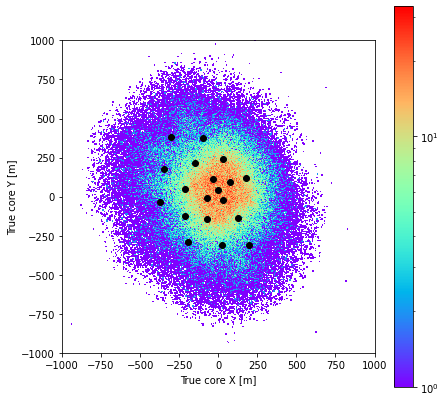
Distribution of true core positions for reconstructed events
Selection cuts: - all showers with >=2 valid images, - LST-subarray stereo trigger, i.e. either 0 or >=2 triggered LSTs (LST-subarray hardware trigger was not required in the simulation)
[21]:
# Not important which simtel you use, just be sure is from this simulation
# https://forge.in2p3.fr/projects/step-by-step-reference-mars-analysis/wiki#The-MC-sample
from ctapipe.io import event_source
indir_simtel = Path("/Volumes/DataCEA_PERESANO/Data/CTA/shared_folder/productions/CTA-S")
simtel = "gamma_20deg_180deg_run100___cta-prod3-demo-2147m-LaPalma-baseline.simtel.gz"
source = event_source(input_url=Path(indir_simtel, simtel), max_events=1)
tel_positions = source.subarray.positions
[22]:
plt.figure(figsize=(7, 7))
plt.gca().set_aspect('equal')

nbins = 600

core_distribution = plt.hist2d(x = reco_showers_stereo_LST["mc_core_x"],
           y = reco_showers_stereo_LST["mc_core_y"],
           bins=[nbins, nbins],
           range=[[-1.e3, 1.e3], [-1.e3, 1.e3]],
           cmap=plt.cm.rainbow,
           norm=LogNorm()
           )

plt.colorbar(core_distribution[3], ax=plt.gca())

# Superimpose telescopes positions
for tel_index in tel_positions.keys():
    plt.plot(tel_positions[tel_index].value[0], tel_positions[tel_index].value[1], 'o', color="black")

plt.xlabel("True core X [m]")
plt.ylabel("True core Y [m]")

plt.show()

fig.savefig(f"./plots/training_true_cores_distro_reco_events_protopipe_{analysisName}.png")
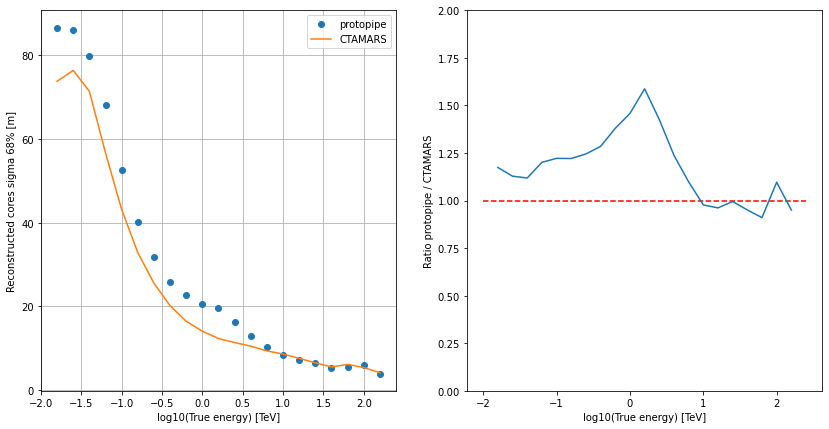
Shower core reconstruction
All showers reconstructed by any 2 telescopes
[23]:
reco_showers_stereo = {}
for i, camera in enumerate(cameras):
    # for each camera table select only rows corresponing to events seen by any >=2 telescopes
    reco_showers_stereo[camera] = reconstructed_showers[camera][reconstructed_showers[camera]["n_tel_reco"] >= 2]
    # then merge the tables
    if i==0:
        allcameras_reco_showers_stereo = reco_showers_stereo[camera]
    else:
        allcameras_reco_showers_stereo = allcameras_reco_showers_stereo.append(reco_showers_stereo[camera])
# Finally drop duplicate showers (stereo information is the same for each event ID)
unique_allcameras_reco_showers_stereo = allcameras_reco_showers_stereo.drop_duplicates(subset=['event_id'])
[24]:
core_res = np.zeros(len(true_energy_bin_centers))

fig = plt.figure(figsize=(14, 7))

plt.subplot(1,2,1)

plt.xlabel("log10(True energy) [TeV]")
plt.ylabel("Reconstructed cores sigma 68% [m]")

true_energy = np.log10(unique_allcameras_reco_showers_stereo["true_energy"])

true_core_x = unique_allcameras_reco_showers_stereo["mc_core_x"]
true_core_y = unique_allcameras_reco_showers_stereo["mc_core_y"]
reco_core_x = unique_allcameras_reco_showers_stereo["reco_core_x"]
reco_core_y = unique_allcameras_reco_showers_stereo["reco_core_y"]

core_distances = np.sqrt((true_core_x - reco_core_x)**2 + (true_core_y - reco_core_y)**2)

for i in range(len(true_energy_bin_centers)):

    mask = (true_energy > true_energy_bin_edges[i]) & (true_energy <= true_energy_bin_edges[i + 1])
    selected_core_distances = np.sort(core_distances[mask])
    core_res[i] = np.percentile(selected_core_distances, 68.0)

plt.plot(true_energy_bin_centers, core_res, 'o', label = "protopipe")

# CTAMARS
plt.plot(CTAMARS_coreres.members["fX"], CTAMARS_coreres.member("fY"), '-', label = "CTAMARS")

plt.grid(which="both")
plt.legend()

plt.subplot(1,2,2)

plt.xlabel("log10(True energy) [TeV]")
plt.ylabel("Ratio protopipe / CTAMARS")

plt.plot(true_energy_bin_centers,
         core_res/CTAMARS_coreres.member("fY"),
         '-')
plt.hlines(1.0, plt.gca().get_xlim()[0], plt.gca().get_xlim()[1], linestyle= '--', color="red")
plt.ylim(0, 2)

plt.show()

fig.savefig(f"./plots/training_shower_core_reco_protopipe_{analysisName}.png")
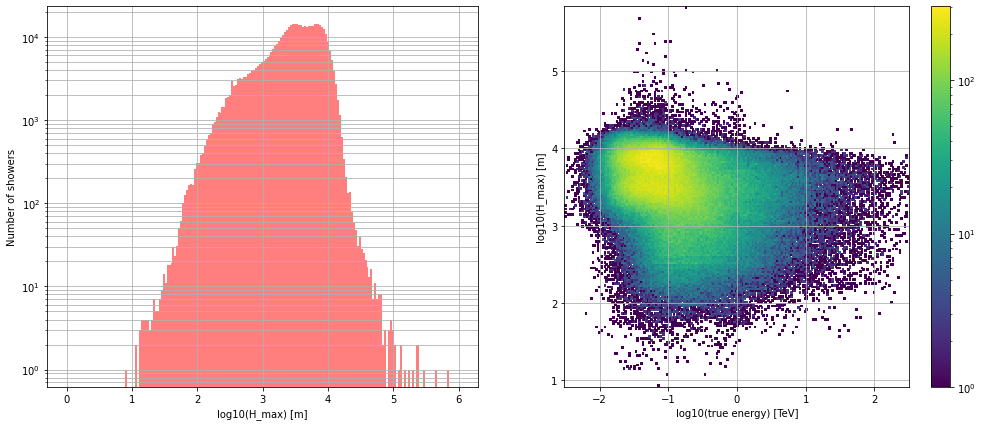
Shower maximum height reconstruction
All showers reconstructed by at least 2 telescopes.
[25]:
plt.figure(figsize=(17,7))

h_max = unique_allcameras_reco_showers_stereo["h_max"]
e_true = unique_allcameras_reco_showers_stereo["true_energy"]
nbins = 200

plt.subplot(1,2,1)

plt.hist(np.log10(h_max),
         bins=nbins,
         range=[0, 6],
         alpha=0.5,
         color="red")
plt.yscale("log")
plt.xlabel("log10(H_max) [m]")
plt.ylabel("Number of showers")
plt.grid(which="both")

plt.subplot(1,2,2)

plt.hist2d(np.log10(e_true), np.log10(h_max), bins=[nbins,nbins], norm=LogNorm())
plt.colorbar()
plt.xlabel("log10(true energy) [TeV]")
plt.ylabel("log10(H_max) [m]")
plt.grid(which="both")

plt.show()

fig.savefig(f"./plots/training_hmax_distro_protopipe_{analysisName}.png")
[ ]: